

 Back to Blog

Explore the shipping questions hidden in your shipment history and how the new Shipping Analytics Dashboard helps answer them faster
For most manufacturers and distributors, shipping is one of the largest operating expenses, yet it’s often one of the hardest areas to fully explain. While many operations can tell you what they spent on transportation in the last month, very few can pinpoint exactly which customers, shipping lanes, service levels, or fulfillment decisions drove those costs, or which shipments drained profitability along the way.
The challenge isn’t a lack of data. Many companies running Varsity Logistics multi-carrier shipping software already have access to detailed parcel, less-than-truckload (LTL), and truckload shipment records stored in their Transdata history. The problem is turning that information into answers. Without clear visibility into this data, important decisions about carrier strategy, customer profitability, and network optimization get made on partial information.
To help close that gap, Varsity Logistics has created the new Shipping Analytics Dashboard. It’s available now and built on the shipment history you already collect, giving operations and management teams a faster way to analyze shipping spend, uncover margin issues, and identify opportunities for cost savings. It’s available now and built on the shipment history you already collect, giving operations and management teams a faster way to analyze shipping spend, uncover margin issues, and identify opportunities for cost savings.
In this blog, we’ll cover why shipping cost has been so hard to see, the questions your shipment history should be answering, and how the dashboard helps teams act on that history.
Why Shipping Cost Is So Hard to See
For most shippers, the problem comes down to a reporting process that was never designed for the questions teams need to ask, and it shows up in three ways: how hard the data is to get to, how late the answers arrive, and how much detail gets lost along the way.
Data Exists, but It Isn’t Easily Accessible
Many IBM i shippers have years of shipping history on file, including details on what shipped, where it went, what it weighed, which zone it fell in, what it cost, and what was billed. But that history usually lives in a shipping system or enterprise resource planning (ERP) system that wasn’t built to be read by the people asking the questions. As a result, getting answers from that data has traditionally required running reports, submitting requests to IT, waiting for results, and exporting them into spreadsheets for further analysis. Every new question repeats this cycle.
Answers Arrive After the Decision
Even when the right data is available, it often arrives after key decisions have already been made. Carrier negotiations move forward, customer agreements are renewed, and operating budgets are finalized based on the best information available at the time. By the time an analysis is complete, the chance to act may have already passed.
Important Details Get Lost in Summary Reports
High-level reporting has its place, but the totals rarely tell the whole story. A company’s overall shipping spend may look reasonable while hiding customers, order types, shipping modes, or destinations that lose money shipment after shipment. Those patterns can be difficult to identify when shipment data is condensed into monthly or quarterly summaries.
The Result: Managing Spend by Assumption
Without detailed visibility, teams only know the total, not what’s driving it. When answers take too much time and effort to uncover, many questions never get asked. Mode decisions made years ago aren’t revisited, origin assignments remain unchanged, and carrier negotiations are based on broad assumptions about shipping volume and network activity.
None of this comes from a lack of data. It comes from data that is hard to reach, slow to analyze, and summarized past the point of usefulness. Closing that gap starts with giving teams direct access to their shipment history.
The Questions Your Shipment History Should Be Answering
But direct access only helps if teams know what to look for. The most useful questions dig into the decisions, patterns, and behaviors that drive spend in the first place.
Location Strategy
- Are shipments leaving from the right origin?
- Which facilities are serving the most distant destinations?
- Are certain shipping locations creating unnecessary zone costs?
Customer demand shifts over time, but origin assignments often stay the same. Shipment history shows which facilities are shipping to distant zones and where routing orders from a closer origin could cut cost.
Carrier and Service Selection
- Which carriers and service levels account for the largest share of transportation spend?
- How does your actual shipping profile compare to what your carrier agreements were built around?
Knowing where costs fall by carrier, service, zone, and weight gives you specifics to bring to carrier negotiations and service-level decisions.
Customers and Orders
- Which customers are profitable to ship to, and which are quietly eroding margin?
- Which order types or modes consume a disproportionate share of spend?
Not every customer costs the same to serve. Some may generate healthy margins while others require shipping patterns, service levels, or destinations that steadily increase transportation costs. Shipment history shows exactly who those customers are and what’s driving their cost to serve.
Network Optimization
- Is zone skipping worth evaluating on your current lanes?
- Are certain destinations consistently generating higher costs?
- Are there shipping patterns that suggest a different fulfillment strategy?
Network changes are hard to justify on assumptions alone, and they carry real cost and commitment. Shipment-level data provides the evidence to identify opportunities and determine whether they’re worth pursuing.
Every one of these questions can be answered from shipment history. What matters is whether answering one takes a filter change or another report request. That’s the problem the Shipping Analytics Dashboard was built to solve.
Introducing Varsity’s Shipping Analytics Dashboard
The Shipping Analytics Dashboard is a new module for Varsity version 4.0 that puts parcel, LTL, and truckload shipment history on a single browser-based screen, giving users direct access to the data behind their transportation decisions. It reads the Transdata files Varsity populates as shipments move to history, so there’s nothing new to capture and no separate reporting environment to maintain. [Explore more about analytics for smarter shipping on IBM i.]
Users can filter by date range, customer type, origin, mode, order type, carrier and service, weight, destination, zone, and more from a single filter bar, and every chart, metric, and table updates as selections change.
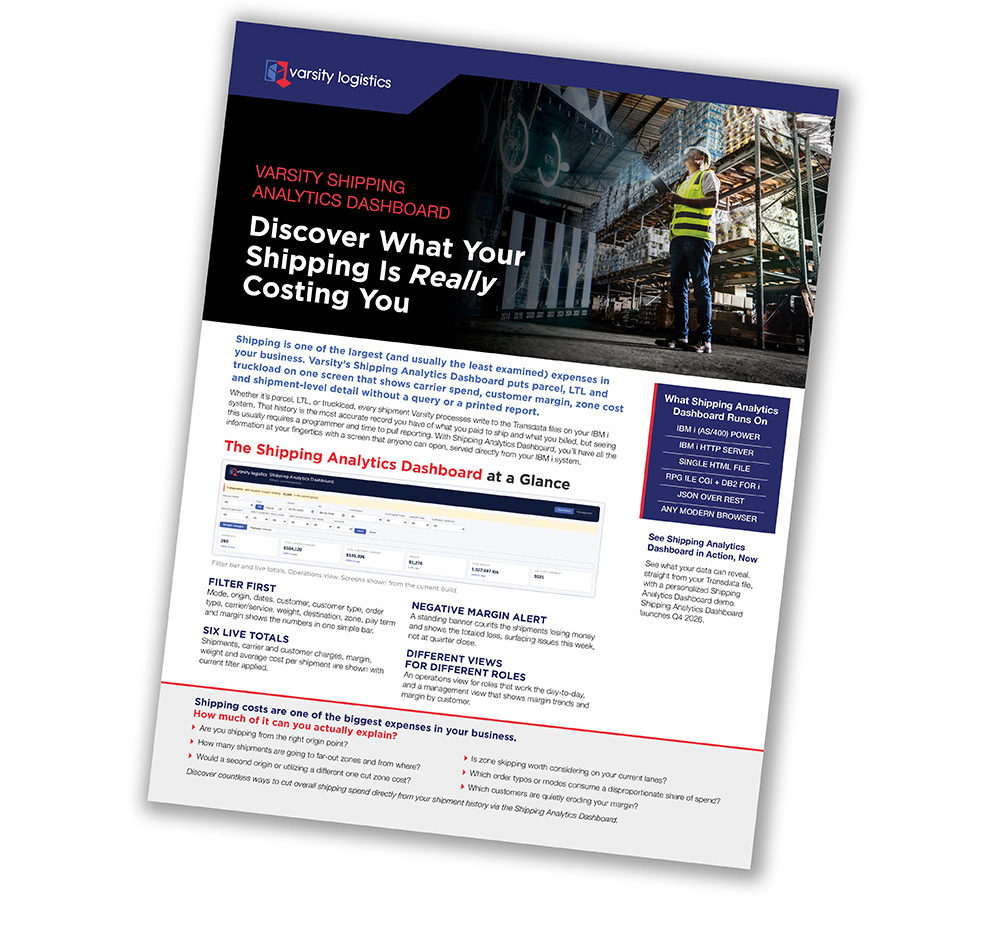
The same filtered data feeds a North American distribution map, carrier spend trends, a zone and weight cost grid, margin views, and a shipment detail table that drills down to the bill of lading and invoice number. Instead of queries, printed reports, and waiting on IT, teams can get from a question to an answer while there’s still time to act on it.
From Data to Action
Visibility only pays off when it changes how a team works. When people can question shipment history directly, a handful of everyday routines start to shift.
Margin Reviews Move from Quarterly to Ongoing
Many organizations don’t discover shipping-related margin issues until a month-end or quarter-end review. By then, hundreds or even thousands of shipments may have already been affected. With access to shipment-level cost and billing data, teams can review margin performance more regularly and identify problems while they’re still manageable.
Rather than simply seeing that profitability declined, they can trace the issue back to the customers, order types, shipping services, or lanes responsible for the loss and take corrective action before it grows. The Shipping Analytics Dashboard’s negative margin alert counts the shipments losing money and totals the loss, so problems surface the same week they happen.
Carrier Negotiations Are Backed by Data
With visibility into where costs actually come from, including zones, weight ranges, service levels, and recurring accessorial charges, transportation teams can enter negotiations with a clearer understanding of their shipping profile. That shifts the conversation from reacting to the carrier’s proposal to presenting where your volume sits and asking for rates that reflect it.
Rate Shopping Rules Get Audited
Carrier selection rules are often set up once and never revisited. With spend broken out by carrier, service, zone, and weight, teams can spot shipments going out on services that cost more than the profile calls for and review the rules that sent them there. When rates change or a new service is added, a quick review catches misrouted shipments before they pile up for months.
Network Decisions Get Sized Before Anyone Invests
Adding a facility, testing zone skipping, or adjusting fulfillment strategies can all have a major impact on transportation costs. They’re also decisions that require substantial time, analysis, and organizational commitment. Shipment history lets teams size the opportunity first (for example, how many shipments go to far zones from each origin and what they cost) and then decide whether it warrants a deeper study.
Mode Decisions Get Revisited on a Schedule
Shipping practices that made sense years ago may not be the most cost-effective choices today, and it’s common for routing rules to go unquestioned once they’re put in place. As customer requirements, order profiles, and carrier rates change, companies can find themselves using parcel services for shipments that may be better suited to LTL, or following routing patterns that no longer align with current shipping volumes. Regular reviews of shipment data catch these mismatches, so outdated rules stop running on autopilot.
Questions Get Answered by the People Asking Them
A key process improvement is reducing the time between asking a question and finding an answer. When operations and management staff can explore shipment data themselves, they don’t wait on report requests. They can follow a trend as it emerges and chase the next question wherever the data leads.
These changes don’t require a new team or a major project. They come from making a few recurring checks part of the routine and acting on what they show. And when better decisions become routine, the financial impact can add up quickly. So, what is that visibility actually worth?
Putting a Number on Better Visibility
Varsity estimates that negotiating with better visibility into shipping patterns, including zones, weight brackets, service levels, and recurring accessorial charges, can reduce shipping spend by 2% to 5%. That’s from carrier negotiations alone, before factoring in savings from improved routing decisions, mode optimization, or the recovery of margin from unprofitable shipments.
To put that into perspective, a company spending $2 million a year on shipping could see potential savings of $40,000 to $100,000 annually. The actual results vary based on your carrier agreements, shipping volume, service mix, and how aggressively your transportation costs are already being managed.
The more useful number is the one hidden in your own shipment data; where costs are concentrated,where margin is leaking, and where the greatest opportunities for improvement exist.
Built for How IBM i Shippers Already Run
For companies on IBM i, many new analytics tools promise better visibility, but they often require organizations to move data into a separate platform, maintain another database, or invest in additional infrastructure just to get started.
None of that applies to the Shipping Analytics Dashboard. It was designed specifically to run on the IBM i environments you already have and work with the data already available within the Varsity ecosystem. Because it’s a browser-based tool, anyone who needs to access the dashboard can do so from their desk. There’s no application server to set up, nothing to install on individual computers, and your shipment data never leaves the IBM i.
It also fits the way your business is organized. Customers and orders can be grouped into your own categories, so the analysis reflects how your team already thinks about accounts and order types. Teams can start analyzing costs, trends, and performance without changing how they process shipments day to day. For existing Varsity customers, the dashboard works alongside ShipSoft™ Parcel, ShipSoft™ Freight, ShipPack, ShipAudit, and ShipView.
See What Your Own Shipment History Shows
Shipping cost doesn’t have to be the expense nobody can fully explain. When the people making decisions about carriers, customers, and routing can see what drives spend, those decisions get made sooner and with more confidence, and the savings follow from there.
The Shipping Analytics Dashboard doesn’t create new data. It puts the data you already have to work.
If you’ve ever wondered whether a customer is costing more than they’re worth, whether you’re shipping from the right location, or whether your carrier agreements reflect your actual shipping profile, the answers are likely already sitting in your shipment history.
Ready to see what’s hiding in yours? Schedule a demo with the Varsity team to learn how your own shipping data can help uncover opportunities to lower costs, protect margins, and improve transportation performance.
Want to see the dashboard at work in a real shipping operation first?
In our Q1 2027 Varsity customer webinar, Concordance Healthcare Solutions will join us for a deep dive into the Shipping Analytics Dashboard and give a behind-the-scenes look at how they use it. Registration details are coming soon, so sign up for the Varsity newsletter to be among the first to know when it opens.